Monitor your consumption manually
To monitor your consumption manually, follow the steps below.
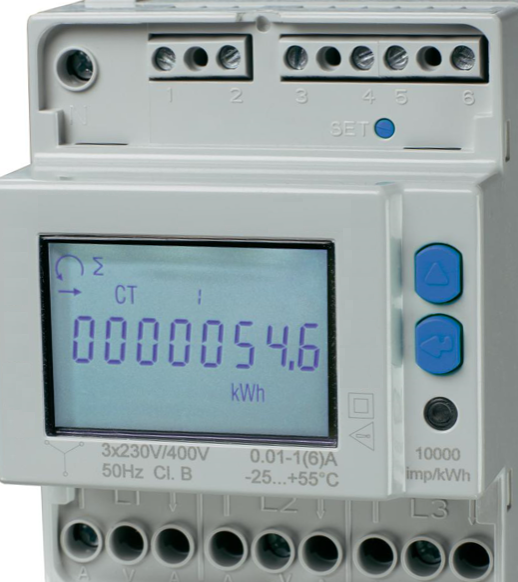
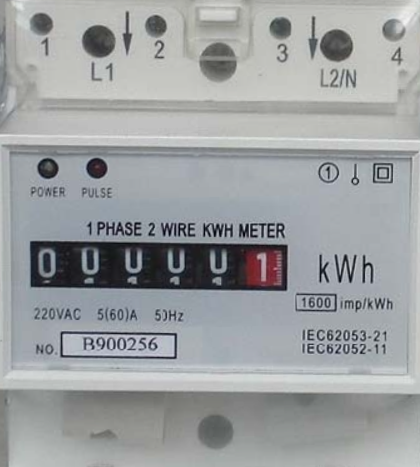
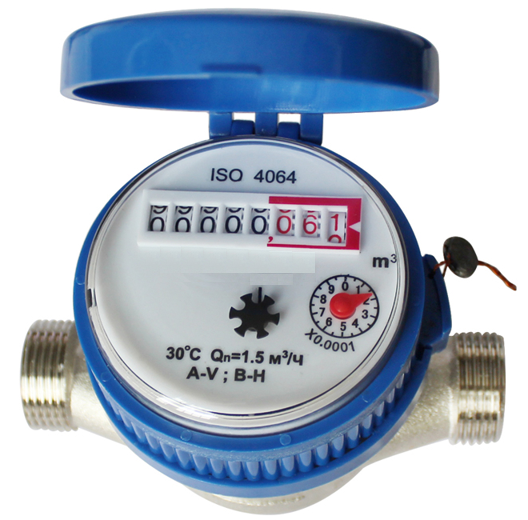
All kinds of consumption can be logged ( electricity, water, ... ), as long as you have a meter with reading measuring the consumption.
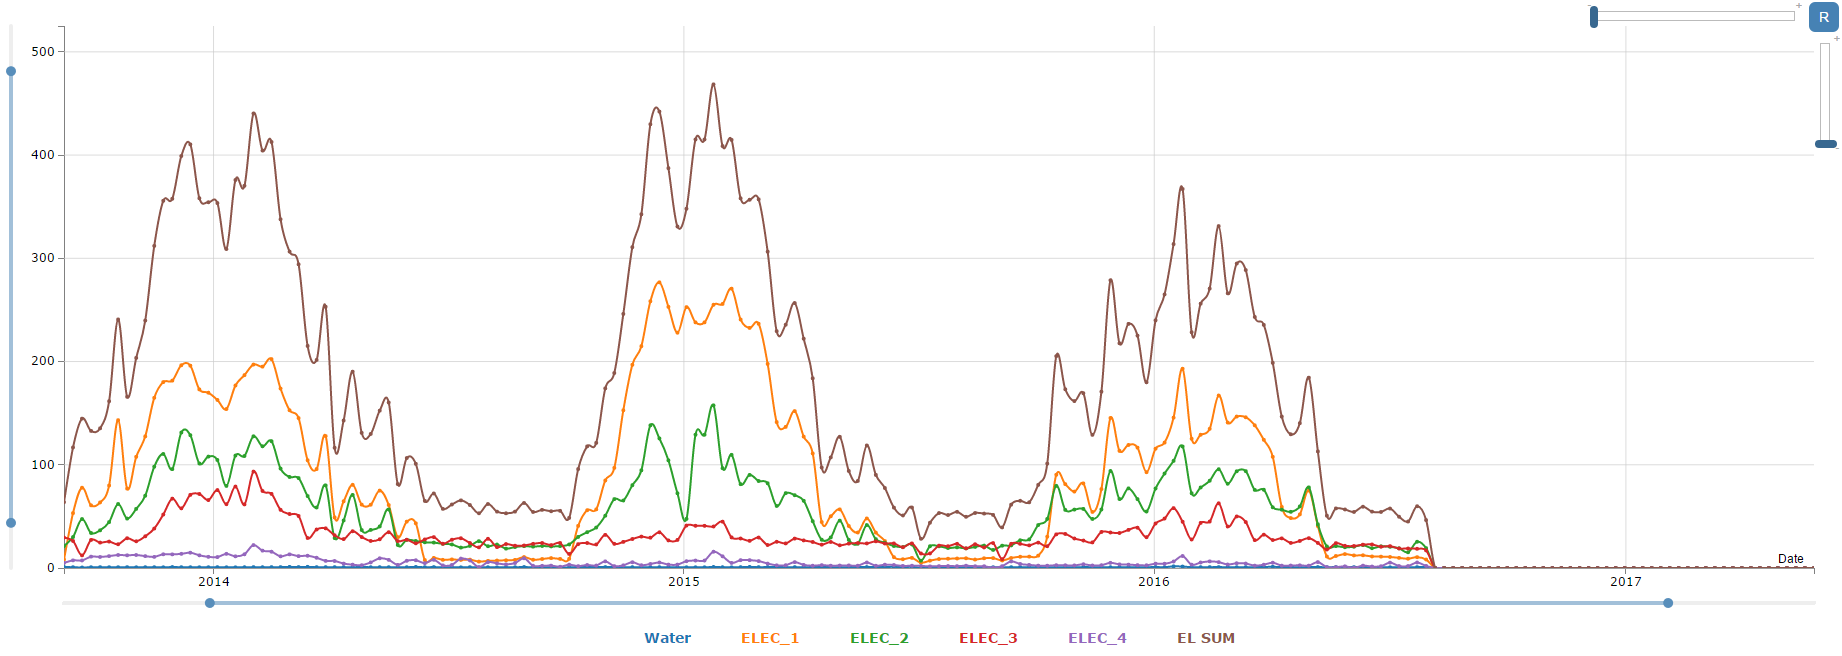
EXAMPLE
EXCEL TEMPLATE
Use this template to enter your meter readings : Download Template
Use this file to check the example above : Download Example
How to save this Excel file on an iPad or iPhone :
When a preview of the Excel spreadsheet is opened in a new tab, there is a toolbar near the top of the document (which fades away after a second). This toolbar lets you open the document in an other installed application (like Excel), where you can save it. To make the toolbar reappear, tap anywhere on the document (besides the embedded image), or go to another tab and open the tab again.
STEP ONE : enter the readings
Enter your readings in the template file you downloaded :
- Change the column names
- At regular intervals ( once a week ) enter your readings
- A chart can be produced when at least 2 lines are entered
STEP TWO : view your chart
Load the excel file to view your chart
- To make your chart, go to the upload page
- Upload your file, with "Calculate difference ?" indicated to :

- Once you have your chart, you can adapt the layout
QUESTIONS
All questions can be posted on the home page ( scroll to the bottom )
Send us a tweet @IntChart
Or contact us at IntChart